py-smps@2.0.0 | a python library for the analysis and visualization of size-resolved aerosol data
py-smps is an open-source python package for the analysis of size-resolved aerosol data.

py-smps is an open-source python package to help analyze and visualize data from aerosol sizing instruments such as the Scanning Mobility Particle Sizer (SMPS), Scanning Electrical Mobility Spectrometer (SEMS), the Grimm 11-D Dust Decoder, and other aerosol-sizing instruments. While software for the analysis of aerosol data exists, it is often proprietary or one-off scripts written by researchers (guilty!). Here, we offer a simple, light-weight solution that can be used for any size-resolved aerosol data whether it is a \$75k SMPS or a $400 low-cost optical particle counter.
The python package is currently maintained by QuantAQ, Inc. and is available for use under the MIT license. All development, suggestions, or support take place on GitHub. Please see the docs for more details.
What this software does do
As of the version 2.0.0 release, the py-smps offers the following features:
- a sensor/instrument agnostic library for the cohesive analysis of size-resolved aerosol data
- methods for computing aerosol statistics (i.e., GM, GSD, etc) for any type of size-resolved dataset
- methods for resampling and/or slicing data
- methods for fitting single or multi-mode particle size distributions
- simple visualizations for particle size distributions at a single point (histogram-like) or over time (heatmap-like)
- a fully documented API
We plan to continue improving the software and are welcome to suggestions or constructive criticism.
What this software doesn't do
- this software does not actually run the instruments/sensors
This software assumes you are beginning with size-resolved aerosol data and is intended to be used in post-analysis.
Installation
Official releases of py-smps can be installed directly from PyPI:
$ pip install smpsSupported Python Versions
- Python 3.7+
Required Dependencies
- pandas
- numpy
- seaborn
- statsmodels
Overview
For examples and detailed documentation about the capabilities of the software, please visit the project documentation.
Once you have py-smps installed, you are ready to get started! To test it out, you can load one of the example SMPS datasets.
import smps

# Load a sample dataset
obj = smps.io.load_sample("boston")
The software assumes that all devices can be defined as a "Particle Sizer" which essentially means that it contains size-resolved aerosol data. A device is defined by it's 'bins' - for example, an SMPS or SEMS might have upwards of 100 size-resolved bins, whereas an Optical Particle Counter (OPC) may have just ~20 or so bins. You can create your own custom GenericParticleSizer object, or use one of the many provided which cover many commercially-available instruments (see table below).
| Commercial Product | py-smps object name |
|---|---|
| Scanning Mobility Particle Sizer (SMPS) | smps.models.SMPS |
| Grimm 11D 'The Dust Decoder' | smps.models.Grimm11D |
| Handix POPS | smps.models.POPS |
| Alphasense OPC-N2 | smps.models.AlphasenseOPCN2 |
| Alphasense OPC-N3 | smps.models.AlphasenseOPCN3 |
| QuantAQ MODULAIR-PM | smps.models.ModulairPM |
| QuantAQ MODULAIR | smps.models.Modulair |
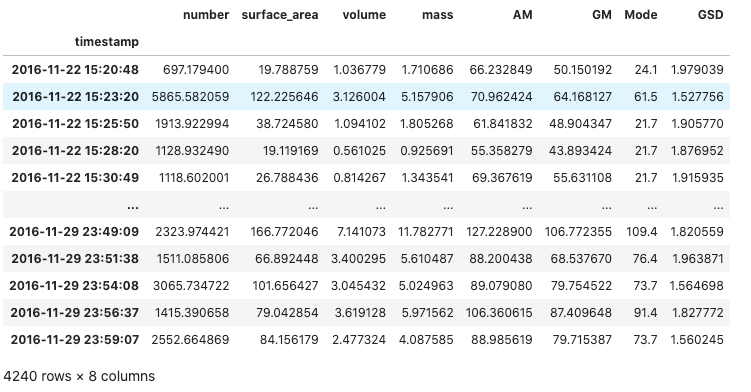
With py-smps, it is simple to compute statistics about the particle size distribution such as the total number concentration, surface area, volume, and mass, as well as the geometric mean and geometric standard deviation:
obj.stats(weight='number')
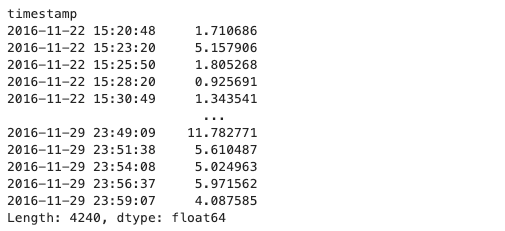
Computing the total number of particles or mass between two diameters is also quick and easy:
obj.integrate(weight='mass', dmin=0., dmax=1., rho=1.65)
In addition to doing analysis, there are a few simply visualizations pre-built including plotting the particle size distribution over time (heatmap-like):
import matplotlib.pyplot as plt

fig, ax = plt.subplots(1, figsize=(14, 6))

ax = smps.plots.heatmap(
	obj.dndlogdp.index,
    obj.midpoints,
    obj.dndlogdp.T.values,
    cmap='viridis',
    ax=ax
)
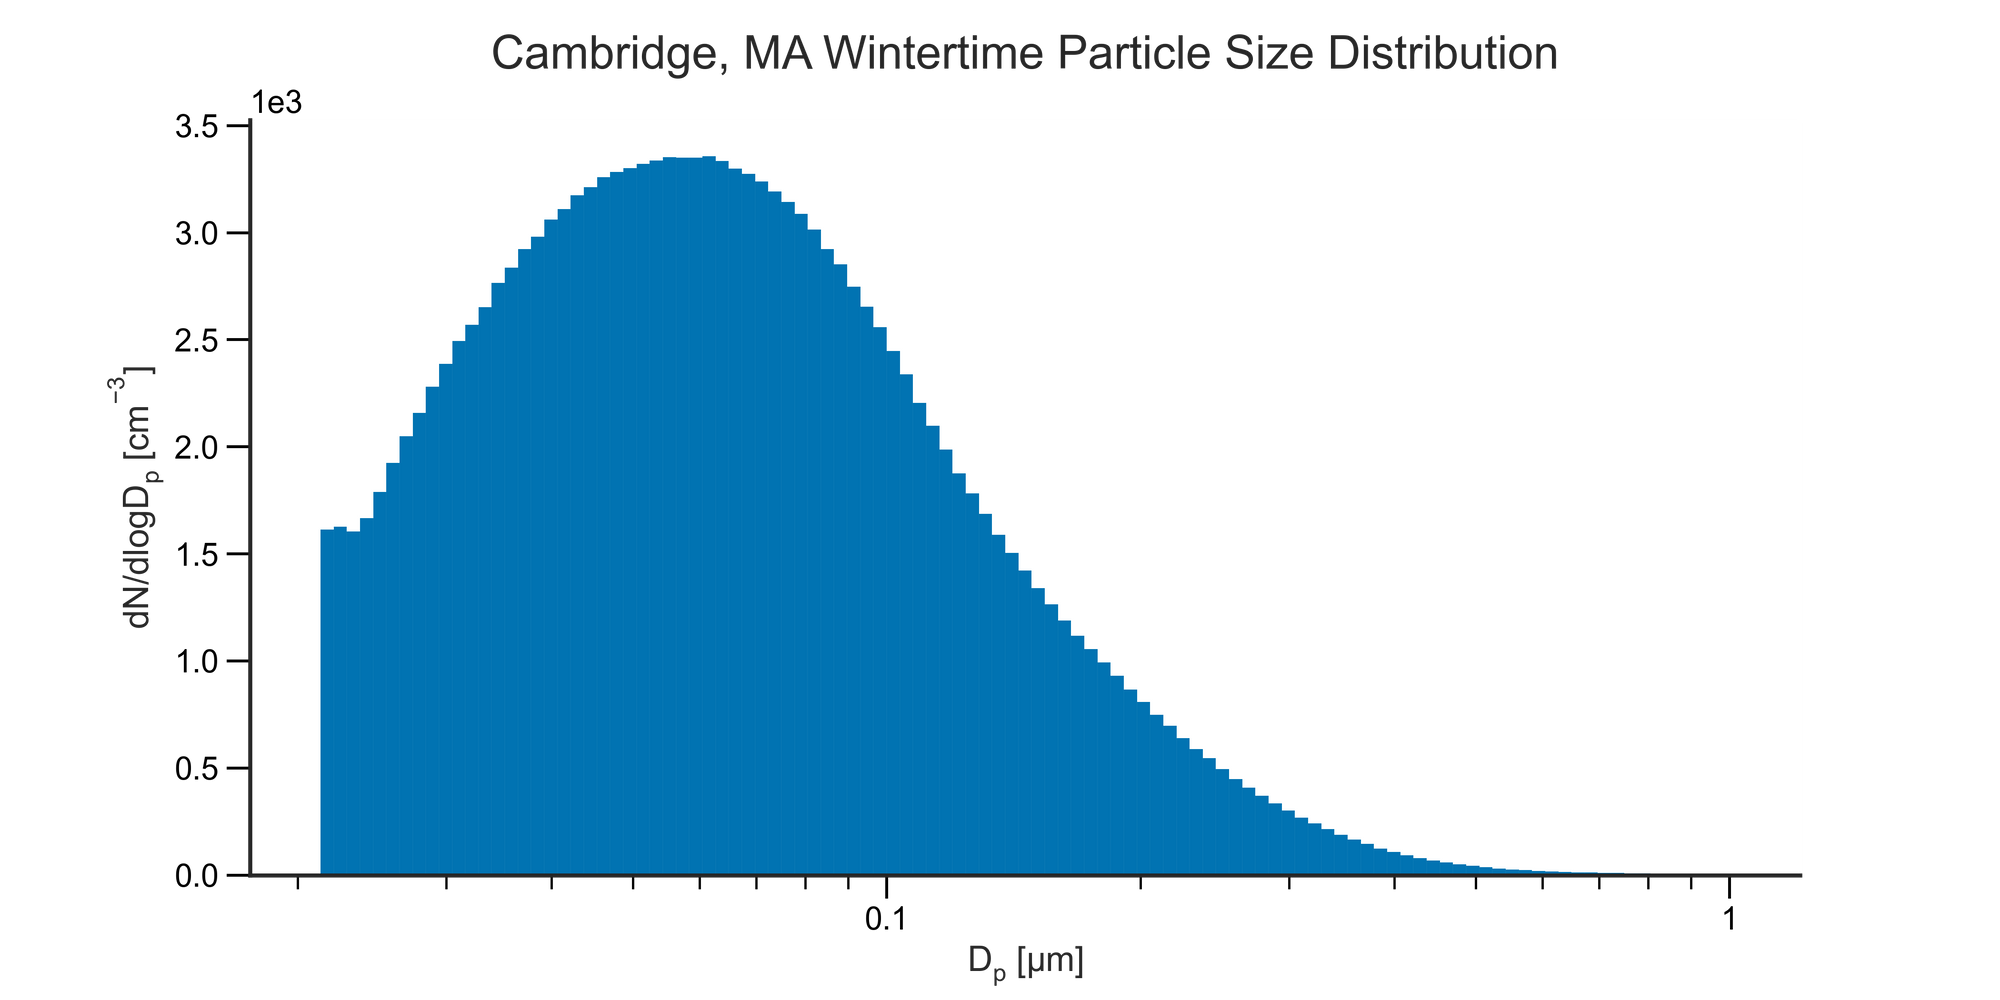
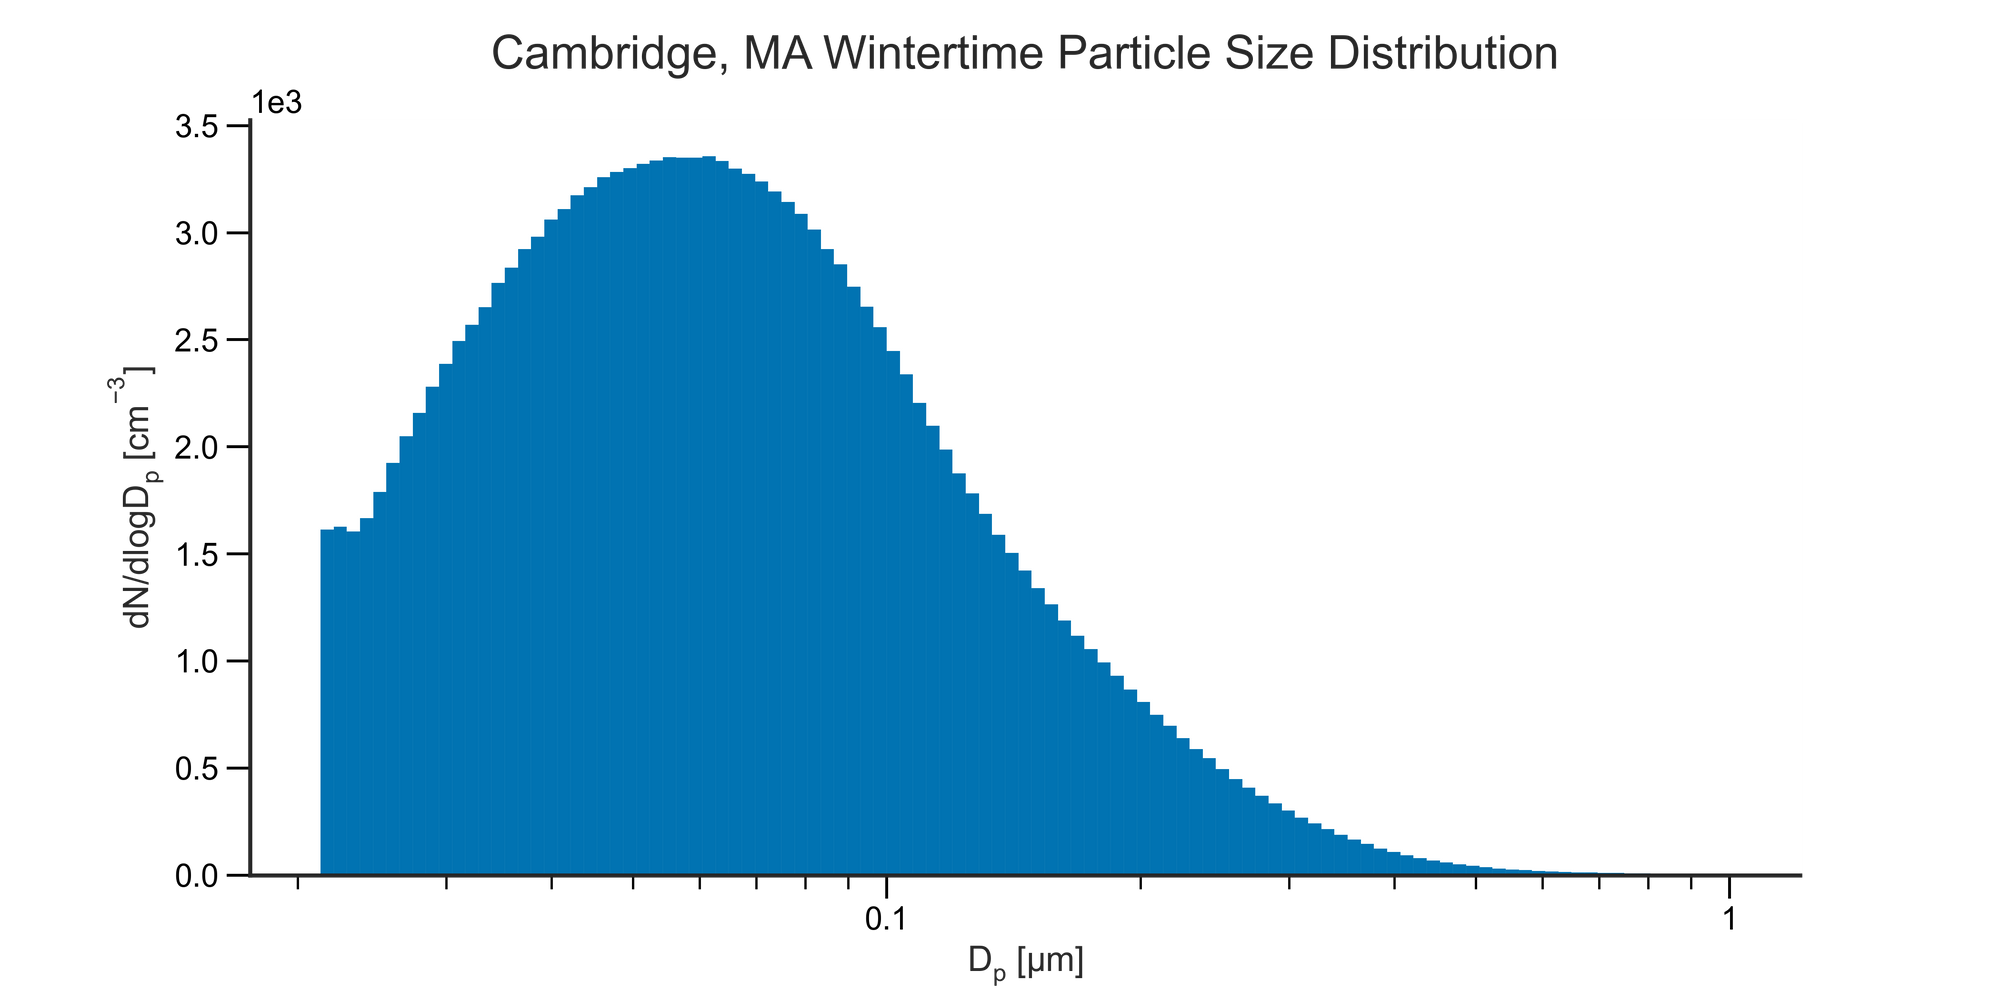
smps.plots.heatmap function.as well as plotting the particle size distribution at a given point in time (histogram-like):
fig, ax = plt.subplots(1, figsize=(12, 6))

ax = smps.plots.histplot(
	obj.dndlogdp,
    obj.bins,
    plot_kws=dict(linewidth=.01),
)

sns.despine()
smps.plots.histplot function.And last, but not least, it is simple and intuitive to fit single- or multi-mode particle size distributions:
from smps.fit import LogNormal

model = LogNormal()

results = model.fit(obj.midpoints, obj.dndlogdp.mean(), modes=1)

results.summary()
smps.fit.LogNormal.Overall, as long as your data has a time-axis and size-resolved aerosol data, py-smps should work! For more information on the code and its capabilities, please check out the docs!
Future Posts
Stay tuned for future posts on more targeted examples utilizing this software to analyze air quality sensor data.

