Deploying web-based analytic dashboards using Plotly Dash, Docker, and Traefik
A quick tutorial on how to build and deploy a simple analytics dashboard using Plotly Dash, Docker, and Traefik.

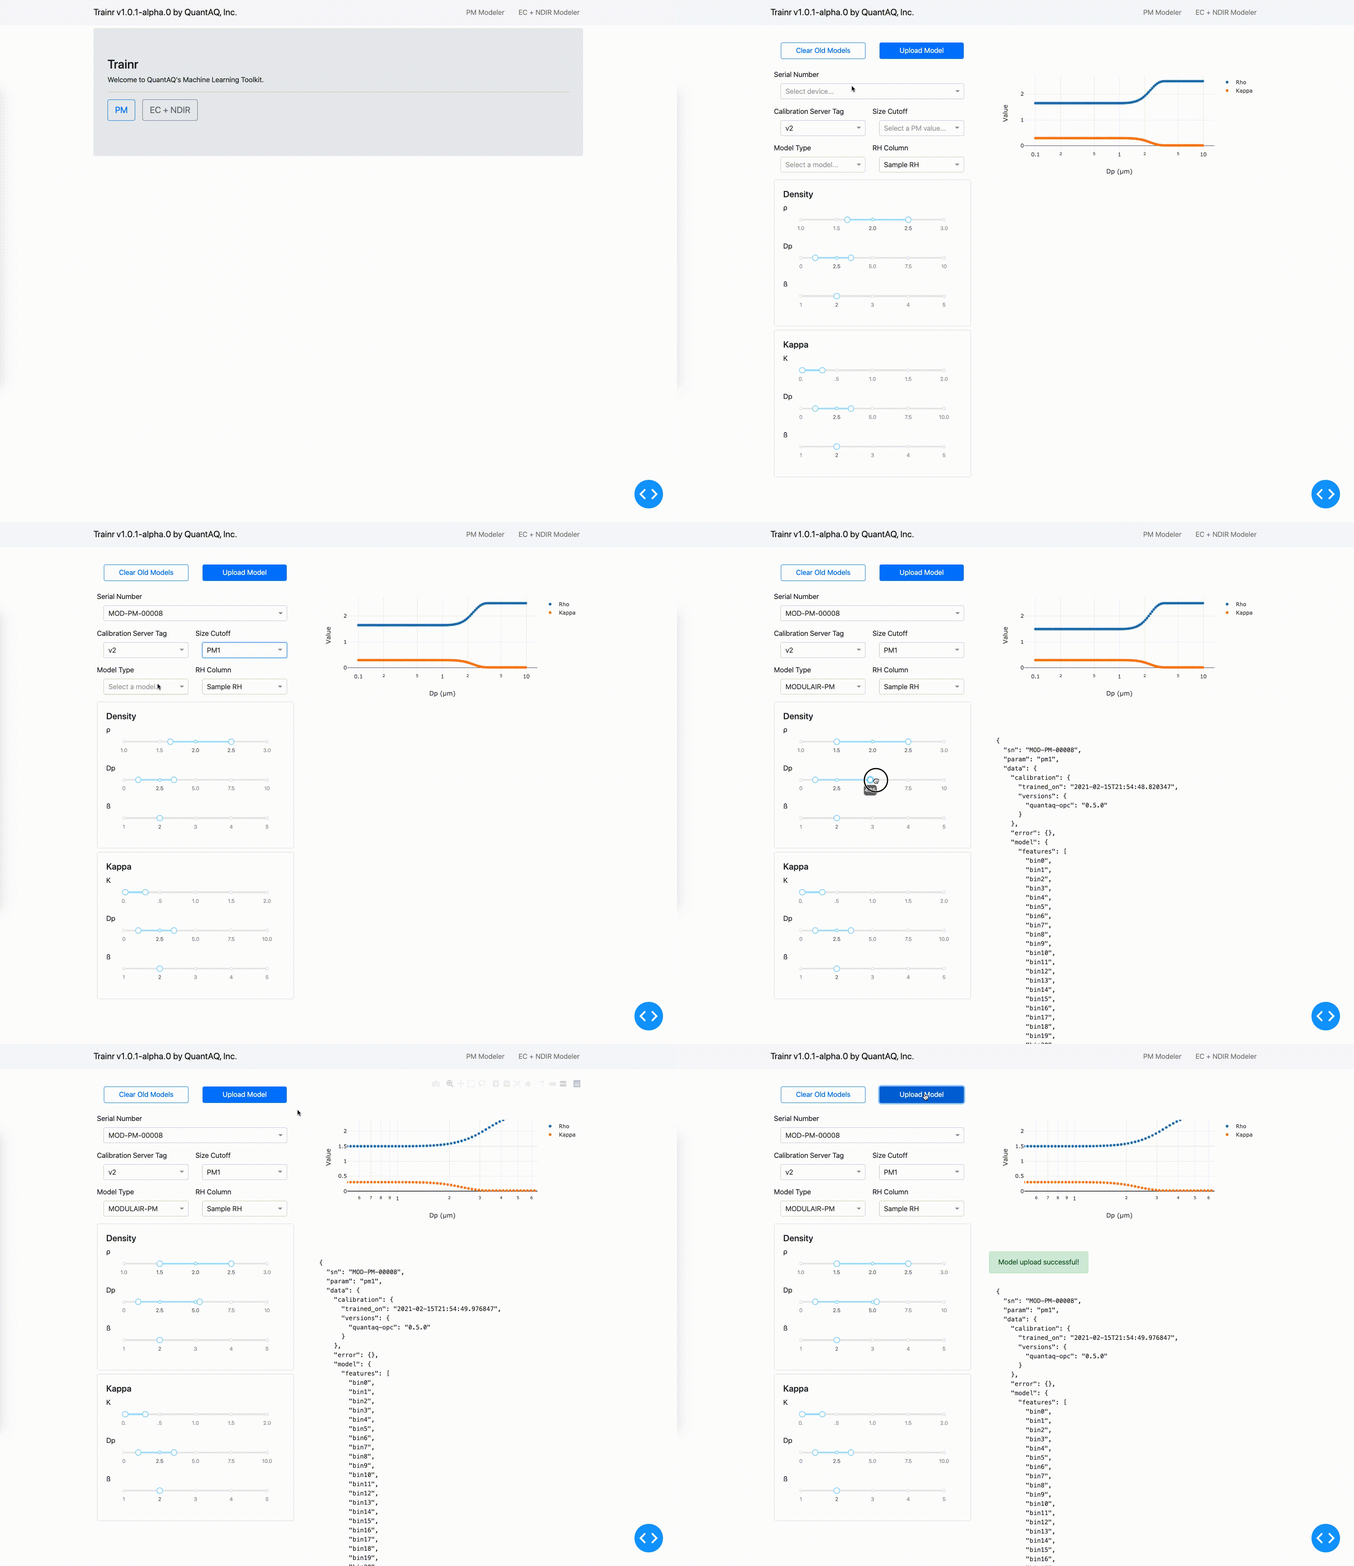
Here at QuantAQ, we build a LOT of dashboards to help make deploying and managing a large number of air quality sensors as easy as possible. For example, here is a quick gif of an internal tool we use to build and deploy ML models for our particulate matter sensors:

To do this, we often use Plotly's Dash framework as a foundation as it enables us to build reactive, manageable dashboards using Python exclusively which makes maintaining them easy (and fun!). In this article, we show you how to deploy a single-page Dash app with Docker and Traefik. This tutorial covers the example code that is available on GithHub here.
While Plotly does offer an enterprise deployment option, we have opted to build our own. To make deployment easier, we build all of our dashboard apps within Docker containers and then use Traefik to route traffic between the apps and to manage all of our microservices. While we won't get into a complete, scalable deployment in this article, we will build a minimum viable app and deployment setup that allows you to run a single-page app using Docker and Traefik.
Python code for our app
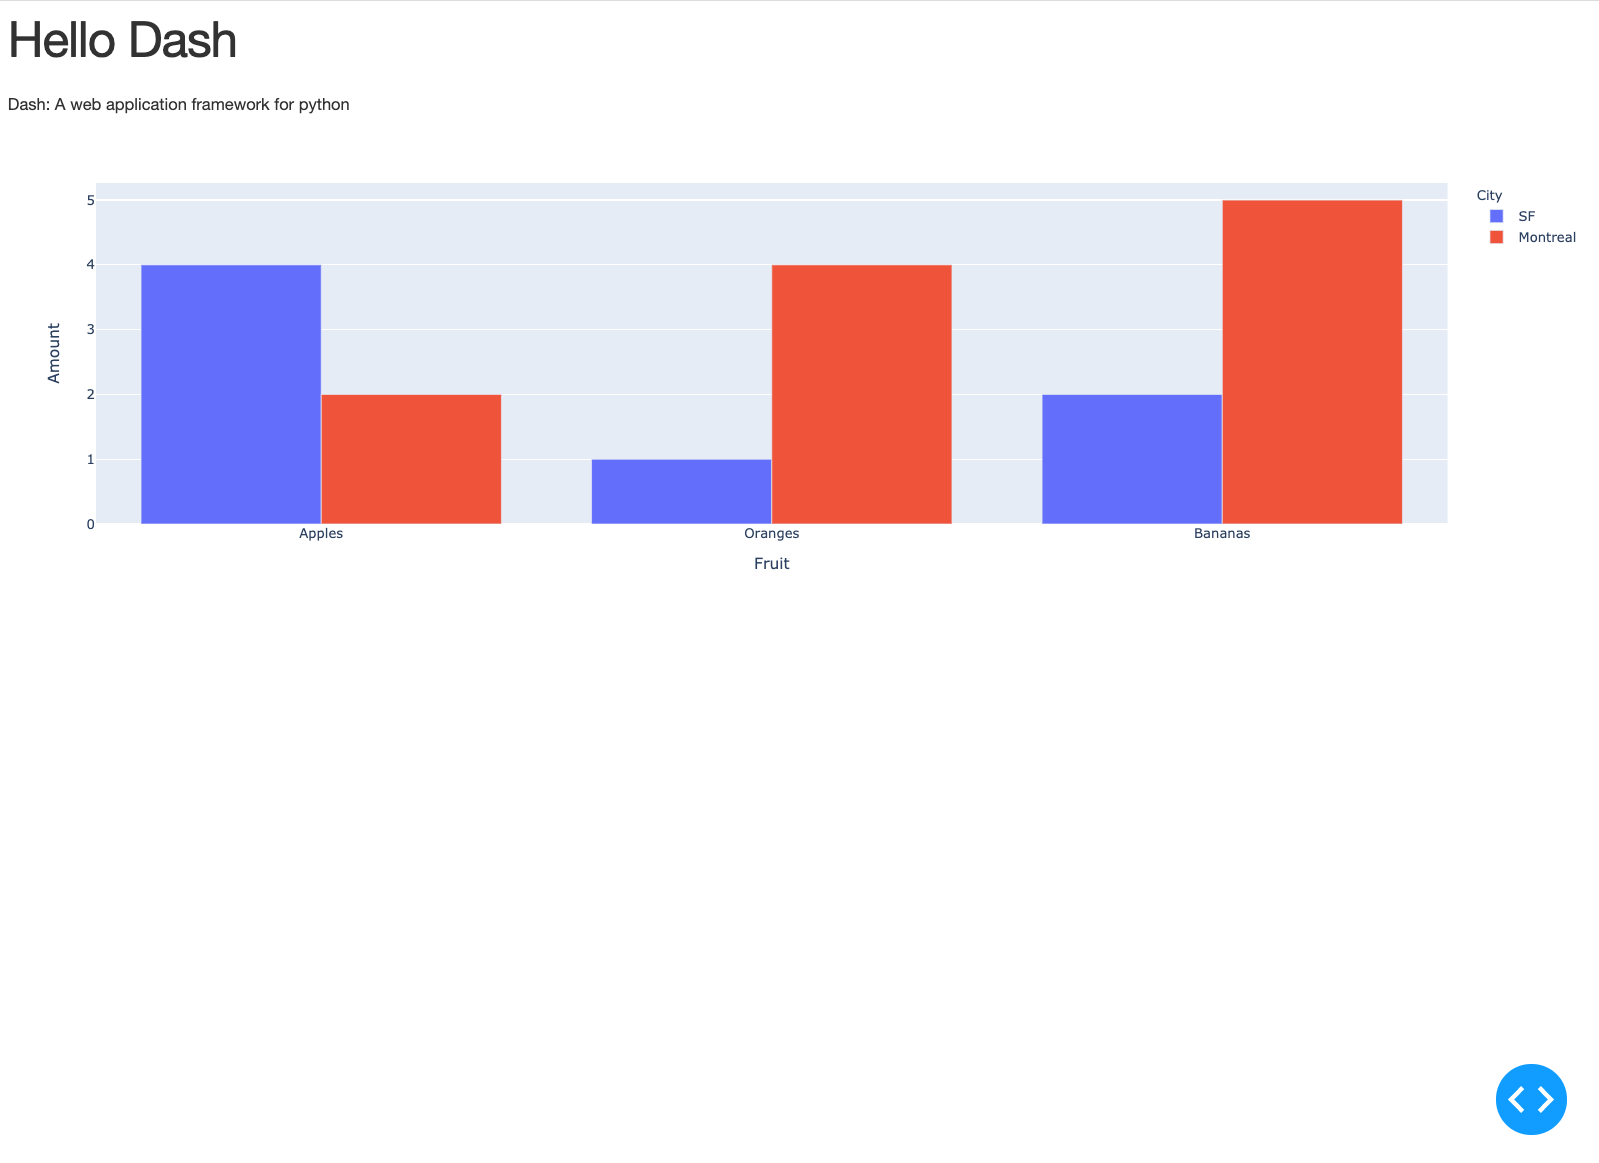
The app we are going to build is going to be very simple - we will copy the Hello Dash app example from the Plotly docs website. The entire app lives in a single python file that is saved as app/index.py.
First, we will make the necessary imports. Here, we import the dash core components, though we don't necessarily use them all in this example. We also import plotly.express to make a simple figure and we import pandas to help us make that figure. These may be totally unnecessary depending on your project needs.
import dash
import dash_core_components as dcc
import dash_html_components as html
from dash.dependencies import Input, Output, State
import plotly.express as px
import pandas as pd
Next, we declare the Dash app and a custom stylesheet to make things look pretty.
app = dash.Dash(
    __name__,
    meta_tags=[
        {
            "name": "viewport",
            "content": "width=device-width, initial-scale=1.0"
        }
    ],

    # Include custom stylesheets here
    external_stylesheets=[
        'https://codepen.io/chriddyp/pen/bWLwgP.css'
    ],

    # Include custom js here
    external_scripts=[],
    suppress_callback_exceptions=True
)
We then build a DataFrame with some sample data and create a Plotly.js figure using the plotly-express library.
# Build a dataframe with test data
df = pd.DataFrame({
    "Fruit": [
    	"Apples", "Oranges", "Bananas", "Apples", "Oranges", "Bananas"],
    "Amount": [4, 1, 2, 2, 4, 5],
    "City": ["SF", "SF", "SF", "Montreal", "Montreal", "Montreal"]
})

# Build a figure
fig = px.bar(df, x="Fruit", y="Amount", color="City", barmode="group")
Finally, we layout our app using a simple H1 with a title, Div with a short explanation, and a Dash Graph component to hold our figure. The last line in our app/index.py file serves the app using the included development server. When moving to production, it is important to change this to a more robust server where debug functionality is turned off.
app.layout = html.Div(
    [
        html.H1("Hello Dash"),

        html.Div("Dash: A web application framework for python"),

        dcc.Graph(id='example-graph', figure=fig)
    ],
)


if __name__ == "__main__":
    app.run_server(host='0.0.0.0', debug=True, port=8000)
Dockerfile for our app
Now that we have the app written, we need to containerize it to make deployment a breeze. To do that, we will build a Docker image. The Dockerfile to build the image is quite simple:
FROM python:3.9-slim
LABEL maintainer="david.hagan@quant-aq.com"

RUN apt-get update -yq && apt-get upgrade -yq && \
    apt-get install -y git && \
    apt-get clean && \
    rm -rf /var/lib/apt/lists/*

ENV PIP_DISABLE_VERSION_CHECK=1

COPY requirements.txt requirements.txt
RUN pip install -r requirements.txt --compile --no-cache-dir

COPY app app

EXPOSE 8000
ENTRYPOINT ["python", "app/index.py"]
We chose to build the image on top of Python 3.9-slim which is a lightweight python distribution that works great for this purpose. We copy over our requirements file which includes all of our python dependencies including dash, pandas, and plotly. We then install those packages, copy over our application folder (here, named app/), and expose port 8000. Finally, we set our entry point to run the app/index.py file which will kick off our application.
The docker-compose file for our setup
Docker compose is a tool used for orchestrating multi-container Docker applications. To use, we define our applications services using a YAML file and can then build and deploy the entire multi-container app using a single command. For this example, we are going to define two containers: the app we just wrote which we will call dash and our reverse proxy which will be called proxy. Here, we have chosen to use the Traefik v2.3 Docker image to serve as our reverse proxy. Traefik is great for serving as both a reverse proxy and load balancing solution for microservice architectures and is incredibly simple to configure (...once you get the hang of it).
The Traefik configuration can be done using service commands as seen below. Here, we configure the Traefik API and dashboard to be enabled and tell it that we are going to be using Docker in swarm mode. Then, on the dash service, we need to make sure we enable traefik by setting the labels in the deploy section of the service definition. Also important is that we set the loadbalancer port to the port where our app is exposed, which as we saw in our app file above is port 8000. This is done through the traefik.http.services.dash.loadbalancer.server.port=8000 line.
version: "3.3"

services:
  proxy:
    image: traefik:v2.3
    command:
      --api=true
      --api.insecure=true
      --api.dashboard=true
      --entryPoints.web.address=:80
      --providers.docker
      --providers.docker.watch=true
      --providers.docker.swarmMode=true
      --log.level=DEBUG
      --ping.entrypoint=web
    ports:
      - 80:80
      - 8080:8080
    networks:
      - dash-net
    depends_on:
      - dash
    volumes:
      - /var/run/docker.sock:/var/run/docker.sock
    deploy:
      replicas: 1
      restart_policy:
        condition: any
      labels:
        - traefik.enable=false
      placement:
        constraints:
          - node.role == manager

  dash:
    image: quant-aq/plotly-dash-traefik-example
    build: .
    networks:
      - dash-net
    deploy:
      replicas: 1
      restart_policy:
        condition: any
      labels:
        - traefik.enable=true
        - traefik.docker.network=dash-net
        - traefik.http.routers.dash.rule=Host(`localhost`)
        - traefik.http.services.dash.loadbalancer.server.port=8000

networks:
  dash-net:
    external: true
Build and run the app
Now that we've written the code we need, we can run our app! To do so, there are two steps:
1. Build the Docker Image
To build the image, we can simply run docker-compose build from the root directory of our app.
$ docker-compose build2. Create the network
To deploy our app, we first need to create the network that we declared as external in our docker-compose file.
$ docker network inspect dash-net >/dev/null 2>&1 || \
    docker network create -d overlay dash-net
3. Run the app
Finally, we can deploy our app using the docker stack deploy command.
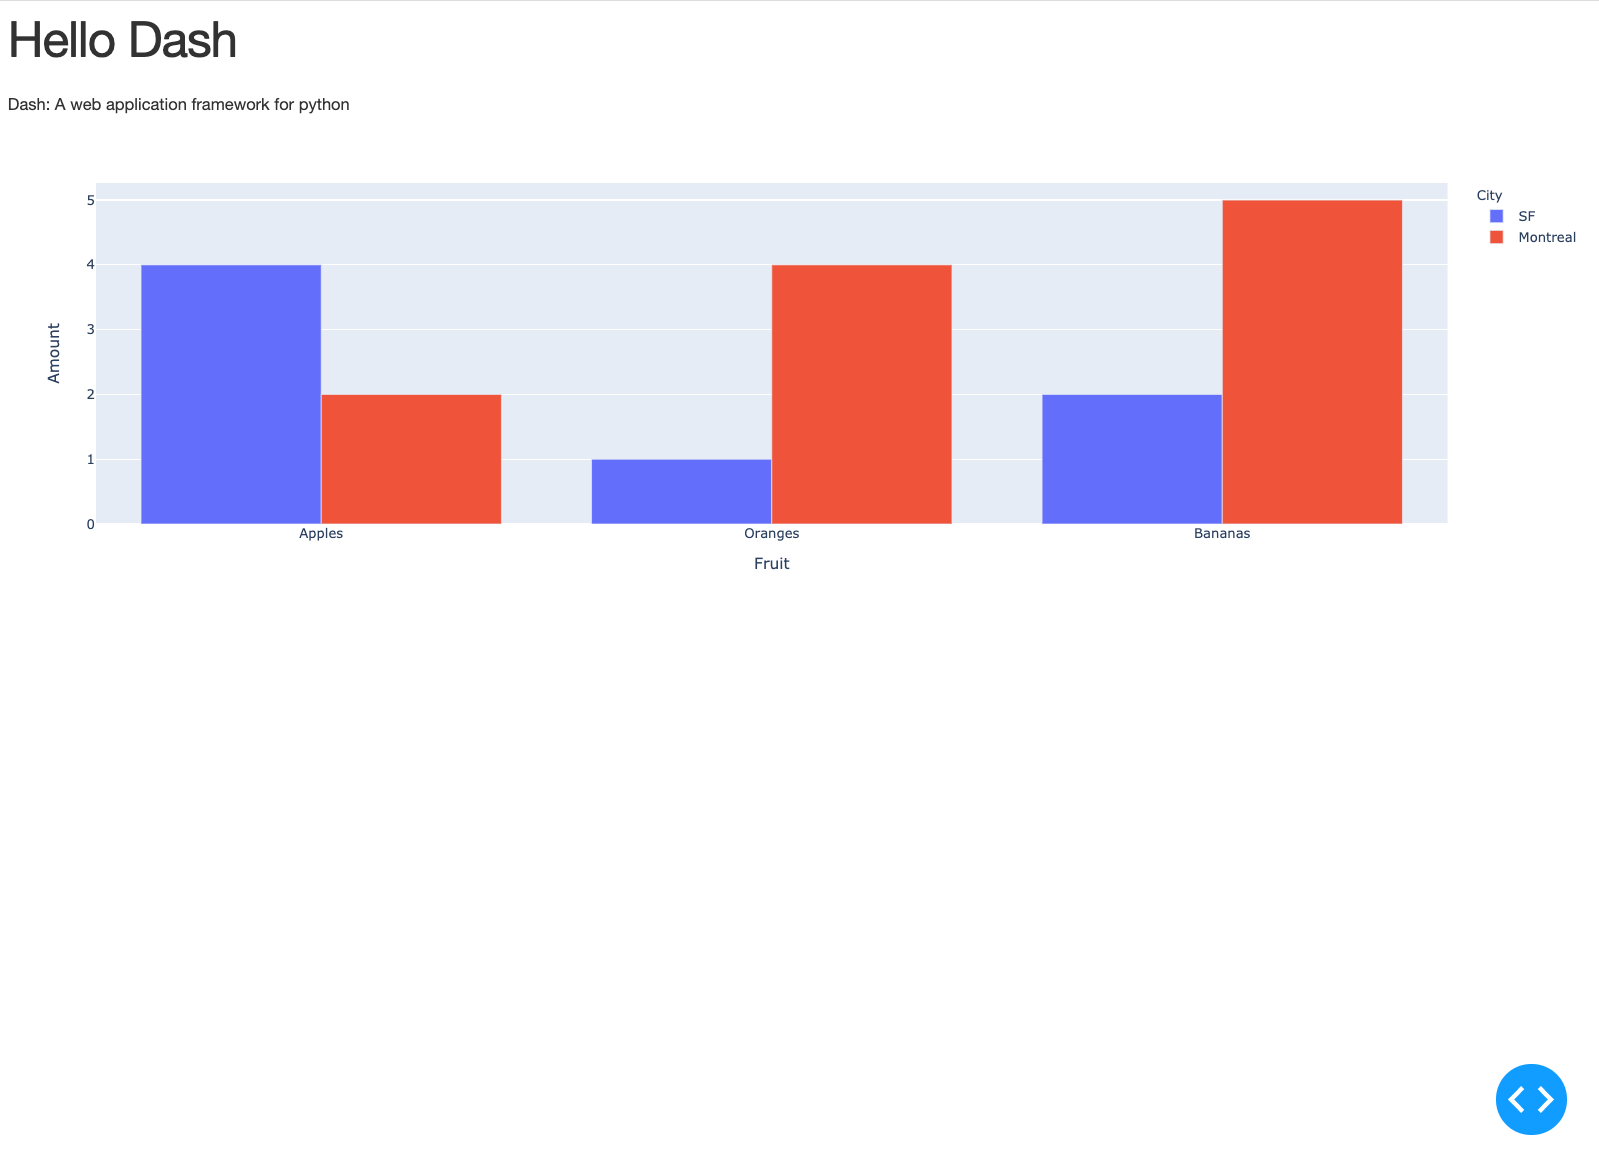
$ docker stack deploy -c docker-compose.yml dashAt this point, you can navigate to http://localhost in your browser and you should see something that looks like this:

You've now built a simple, single-page Dash app, Dockerized it, and deployed it with Traefik as a reverse proxy! Make sure to check back in the future for more tutorials on building analytics dashboards.
The entire example shown above can be found on our GitHub page at the link below.

